The quickest way to do nothing

As I was debugging something recently, an instruction popped up that seemed a little incongruous:

lea 0x0(%edi,%eiz,1),%edi

Now this is an interesting instruction on a few levels. Firstly, %eiz is a psuedo-register that simply equates to zero somewhat like MIPS r0; I don't think it is really in common usage. But when you look closer, this instruction is a fancy way of doing nothing. It's a little clearer in Intel syntax mode:

lea    edi,[edi+eiz*1+0x0]

So we can see that this is using scaled indexed addressing mode to load into %edi the value in %edi plus 0 * 1 with an offset of 0x0; i.e. put the value of %edi into %edi, i.e. do nothing. So why would this appear?

What we can see from the disassembley is that this single instruction takes up an impressive 7 bytes:

8048489:    8d bc 27 00 00 00 00    lea    edi,[edi+eiz*1+0x0]

Now, compare that to a standard nop which requires just a single byte to encode. Thus to pad out 7 bytes of space would require 7 nop instructions to be issued, which is a significantly slower way of doing nothing! Let's investigate just how much...

Below is a simple program that does nothing in a tight-loop; firstly using nops and then the lea do-nothing method.

#include <stdio.h>
#include <stdint.h>
#include <time.h>

typedef uint64_t cycle_t;

static inline cycle_t
i386_get_cycles(void)
{
        cycle_t result;
        __asm__ __volatile__("rdtsc" : "=A" (result));
        return result;
}

#define get_cycles i386_get_cycles

int main() {

    int i;
    uint64_t t1, t2;

    t1 = get_cycles();

    /* nop do nothing */
    while (i < 100000) {
        __asm__ __volatile__("nop;nop;nop");
        i++;
    }
    t2 = get_cycles();
    printf("%ld\n", t2 - t1);

    i = 0;
    t1 = get_cycles();

    /* lea do-nothing */
    while (i < 100000) {
        __asm__ __volatile__("lea 0x0(%edi,%eiz,1),%edi");
        i++;
    }

    t2 = get_cycles();
    printf("%ld\n", t2 - t1);
}

Firstly, you'll notice that rather than the 7-bytes mentioned before, we're comparing 3-byte sequences. That's because the lea instruction ends up encoded as:

8048388:       8d 3c 27                lea    (%edi,%eiz,1),%edi

When you hand-code this instruction, you can't actually convince the assembler to pad out those extra zeros for the zero displacement because it realises it doesn't need them, so why would it waste the space! So, how did they get in there in the original disassembley? If gas is trying to align something by padding, it has built-in sequences for the most efficient way of doing that for different sizes (you can see it in i386_align_code of gas/config/tc-i386.c which adds the extra 4 bytes in directly).

Anyway, we can build and test this out (note you need the special -mindex-reg flag passed to gas to use the %eiz syntax):

$ gcc -O3 -Wa,-mindex-reg  -o wait wait.c
$ ./wait
300072
189945

So, if you need 3-bytes of padding in your code for some reason, it's ~160% slower to pad out 3-bytes with no-ops rather than a single larger instruction (at least on my aging Pentium M laptop).

So now you can rest easy knowing that even though your code is doing nothing, it is doing it in the most efficient manner possible!
Review : The Race for a New Game Machine

I recently finished The Race for a New Game Machine: Creating the Chips Inside the XBox 360 and the Playstation 3 (David Shippy and Mickie Phipps); an interesting insight into the processor development process from some of the lead architects.

The executive summary is : Sony, Toshiba and IBM (STI) decided to get together to create the core of the Playstation 3 — the Cell processor. Sony, with their graphics and gaming experience, would do the Synergistic Processing Elements; extremely fast but limited sub-units specialising in doing 3D graphics and physics work (i.e. great for games). IBM would do a Power based core that handled the general purpose computing requirements.

The twist comes when Microsoft came along to IBM looking for the Xbox 360 processor, and someone at IBM mentioned the Power core that was being worked on for the Playstation. Unsurprisingly, the features being built for the Playstaion also interested Microsoft, and the next thing you know, IBM is working on the same core for Microsoft and Sony at the same time, without telling either side.

This whole chain of events makes for a very interesting story. The book is written for a general audience, but you'll probably get the most out of it if you already have some knowledge of computer architecture; if you're trying to understand some of the concepts referred to from the two line descriptions you'll get a bit lost (H&P it is not).

The only small criticism is that it sometimes falls into reading a bit like a long LinkedIn recommendation. However, the book is very well paced, and throws in just enough technical tidbits amongst the corporate and personal dramas to make it a very fun read.

One thing that is talked about a bit is the fan-out of four (FO4) metric used in the designers quest to push the chip as fast as possible (and, as mentioned many times in the book, faster than what Intel could do!). I thought it might be useful to expand on this interesting metric a bit.

FO4

One problem facing chip architects is that, thanks to Moore's Law, it is hard to find a constant to compare design versus implementation. For example, you may design an amazing logic-block to factor large integers into products of prime numbers, but somebody else with better fabrication facilities might be able to essentially brute-force a better solution by producing faster hardware using a much less innovative design.

Some metric is needed that can compare the two designs discounting who has the better fabrication process. This is where the FO4 comes in.

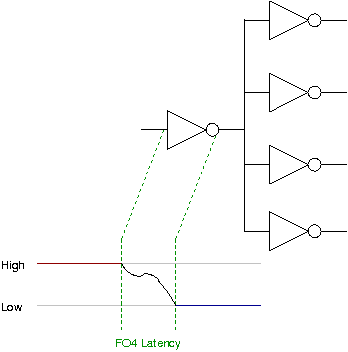
When you change the input to a logic gate, it is not like it magically flips the output to the correct level instantaneously. There is a latency while everything settles to its correct level — the gate delay. The more gates connected to the output of a gate the more current required, which has additional effects on latency. The FO4 latency is defined as the time required to flip an inverter gate connected to (fanned-out) to four other inverter gates.

Fan-out of four

Thus you can describe the latency of other logic blocks in multiples of FO4 latencies. As this avoids measuring against wall-time it is an effective description of the relative efficiency of logic designs. For example, you may calculate that your factoriser has a latency of 100 FO4. Just because someone else's 200 FO4 factoriser gets a result a few microseconds faster thanks to their fancy ultra-low-FO4-latency fabrication process, you can still show that your design, at least a priori, is better.

The book refers several times to efforts to reduce the FO4 of the processor as much as possible. The reason this is important in this context is that the maximum latency on the critical path will determine the fastest clock speed you can run the processor at. For reasons explained in the book high clock speed was a primary goal, so every effort had to be made to reduce latencies.

All modern processors operate as a production line, with each stage doing some work and passing it on to the next stage. Clearly the slowest stage determines the maximum speed that the production line can run at (weakest link in the chain and all that). For example, if you clock at 1Ghz, that means each cycle takes 1 nanosecond (1s / 1,000,000,000Hz). If you have a F04 latency of say, 10 picoseconds, that means any given stage can have a latency of no more than 100 FO4 — otherwise that stage would not have enough time to settle and actually produce the correct result.

Thus the smaller you can get the FO4 latencies of your various stages, the higher you can safely up the clock speed. One way around long latencies might be to split-up your logic into smaller stages, making a much longer pipeline (production line). For example, split your 100 FO4 block into two 50 FO4 stages. You can now clock the processor higher, but this doesn't necessarily mean you'll get actual results out the end of the pipeline any faster (as Intel discovered with the Pentium 4 and it's notoriously long pipelines and corresponding high clock rates).

Of course, this doesn't even begin to describe the issues with superscalar design, instruction level parallelism, cache interaction and the myriad of other things the architects have to consider.

Anyway, after reading this book I guarantee you'll have an interesting new insight the next time you fire-up Guitar Hero.

rdtsc - now even less useful!

An interesting extract from the latest IA32 SDM (18.20.5)

The TSC, IA32_MPERF, and IA32_FIXED_CTR2 operate at the same, maximum-resolved frequency of the platform, which is equal to the product of scalable bus frequency and maximum resolved bus ratio.

For processors based on Intel Core microarchitecture, the scalable bus frequency is encoded in the bit field MSR_FSB_FREQ[2:0] at (0CDH), see Appendix B, "Model-Specific Registers (MSRs)". The maximum resolved bus ratio can be read from the following bit field:

  • If XE operation is disabled, the maximum resolved bus ratio can be read in MSR_PLATFORM_ID[12:8]. It corresponds to the maximum qualified frequency.
  • IF XE operation is enabled, the maximum resolved bus ratio is given in MSR_PERF_STAT[44:40], it corresponds to the maximum XE operation frequency configured by BIOS.

In summary, TSC increment = (scalable bus frequency) * (maximum resolved bus ratio). This implies the TSC is incrementing based on some external bus source (any hardware engineers explain what happened for Core here?), and is a departure from simply assuming that the TSC increments once for each CPU cycle.

The interesting bit is that if XE operation is disabled, the bus ratio is assumed to be the maximum qualified frequency. This seems to mean that if you overclock your CPU and your processor is running at higher than the qualified frequency, attempts to measure the CPU speed by counting TSC ticks over a given time may yeild the wrong results (well, will yield the rated result; i.e. the speed of the processor you bought out of the box).

While interesting, this divergence is probably has little practical implications because using the TSC for benchmarking is already fraught with danger. You have to be super careful to make sure the compiler and processor don't reschedule things around you and handle other architectural nuances. If you need this level of information, you're much better using the right tools to get it (my favourite is perfmon2).

Compare and Swap with PIC

Our Dear Leader Sam Hocevar has previously blogged about PIC and inline ASM. Today I came across a sort of extension to this problem.

Consider the following code, which implements a double word compare and swap using the x86 cmpxchg8b instruction (for a bonus you can lock it to make it atomic).

#include <stdio.h>

typedef struct double_word_t {
    int a;
    int b;
} double_word;

/* atomically compare old and mem, if they are the same then copy new
   back to mem */
int compare_and_swap(double_word *mem,
             double_word old,
             double_word new) {

    char result;
    __asm__ __volatile__("lock; cmpxchg8b %0; setz %1;"
                 : "=m"(*mem), "=q"(result)
                 : "m"(*mem), "d" (old.b), "a" (old.a),
                   "c" (new.b), "b" (new.a)
                 : "memory");
    return (int)result;
}

int main(void)
{

    double_word w = {.a = 0, .b = 0};
    double_word old = {.a = 17, .b = 42};
    double_word new = {.a = 12, .b = 13};

    /* old != w, therefore nothing happens */
    compare_and_swap(&w, old, new);
    printf("Should fail -> (%d,%d)\n", w.a, w.b);

    /* old == w, therefore w = new */
    old.a = 0; old.b = 0;
    compare_and_swap(&w, old, new);
    printf("Should work  -> (%d,%d)\n", w.a, w.b);

    return 0;
}

This type of CAS can be used to implement lock-free algorithms (I've previously blogged about that sort of thing).

The problem is that the cmpxchg8b uses the ebx register, i.e. pseudo code looks like:

if(EDX:EAX == Destination) {
    ZF = 1;
    Destination = ECX:EBX;
}
else {
    ZF = 0;
    EDX:EAX = Destination;
}

PIC code reserves ebx for internal use, so if you try to compile that with -fPIC you will get an error about not being able to allocate ebx.

A first attempt to create a PIC friendly version would simply save and restore ebx and not gcc anything about it, something like:

__asm__ __volatile__("pushl %%ebx;"   /* save ebx used for PIC GOT ptr */
             "movl %6,%%ebx;" /* move new_val2 to %ebx */
             "lock; cmpxchg8b %0; setz %1;"
             "pop %%ebx;"     /* restore %ebx */
                 : "=m"(*mem), "=q"(result)
             : "m"(*mem), "d" (old.b), "a" (old.a),
               "c" (new.b), "m" (new.a) : "memory");

Unfortunately, this isn't a generic solution. It works fine with the PIC case, because gcc will not allocate ebx for anything else. But in the non-PIC case, there is a chance that ebx will be used for addr. This would cause a probably fairly tricky bug to track down!

The solution is to use the #if __PIC__ directive to either tell gcc you're clobbering ebx in the non-PIC case, or just keep two versions around; one that saves and restores ebx for PIC and one that doesn't.

Playing with the x86 PMU

A discussion about commas lead to an excuse to have a play with the IA-32 processor performance managment unit (PMU). To start, take two versions of a program to count the number of commas in a text file — one in C and one in Python. The C one runs faster on the input data set of ~60MiB of random data, but why?

The CPU performance monitors give are the key to getting some idea of where the programs spend their time. I like to use perfmon2 because it's what I know, but Oprofile can do it too. All the available events for IA-32 are described in the manual; I currently of no better way of finding out about them than just reading it. On Itanium I reccommend Caliper which, for the most common situations, does most of the work for you and presents it in a nice report. Intel's Vtune also does a similar thing.

The first thing to investigate is if the CPU is getting enough instructions to keep busy. The IFU_MEM_STALL metric is a good place to start as it is triggered when the instruction fetch pipeline is stalled, presumably waiting on either the ITLB or the trace buffer (Icache).

$ pfmon -e CPU_CLK_UNHALTED,IFU_MEM_STALL ./comma < ./randomcommas
340559375 CPU_CLK_UNHALTED
   192115 IFU_MEM_STALL
$ pfmon -e CPU_CLK_UNHALTED,IFU_MEM_STALL python -Sc "import sys; print sum(l.count(',') for l in sys.stdin)" < ./randomcommas
1287100
4571257047 CPU_CLK_UNHALTED
 71981750 IFU_MEM_STALL

That works out to 0.05% of total cycles for the C version and 1.5% for the Python version, neither of which sets off immediate warning bells. If it did, we could start drilling down to things like the L2_IFETCH and ITLB_MISS events, or the BR_* branch events to try and see why the CPU is having to wait to get its next instruction.

Next it is useful to find the CPI (cycles per instruction). This is calculated by the ratio of retired instructions against the number of CPU cycles; since a superscalar machine can issue more than one instruction per cycle this should ideally be much greater than 1 (for example, an Itanium can execute up to 6 instructions each cycle).

$ pfmon -e INST_RETIRED,CPU_CLK_UNHALTED ./comma < ./randomcommas
542953593 INST_RETIRED
340612036 CPU_CLK_UNHALTED
$ pfmon -e INST_RETIRED,CPU_CLK_UNHALTED python -Sc "import sys; print sum(l.count(',') for l in sys.stdin)" < ./randomcommas
1194455205 INST_RETIRED
4569931735 CPU_CLK_UNHALTED

This works out at a CPI of 1.59 for the C version and 0.26 for the Python version. The Python version is clearly spending a lot of time waiting, because it isn't even able to issue one instruction every cycle.

At this point it seems the CPU has enough instructions to do, but it is sitting around waiting to get through those instructions. This suggests the waiting is related to getting data from the cache.

The load and store requests from the L2 cache are accounted to the L2_LD and L2_ST events respectively. These have the ability to mask out cache lines in different states of the MESI protocol, but for this we don't care so just ask pfmon to show us everything.

$ pfmon -e L2_LD:M:E:S:I,L2_ST:M:E:S:I ./comma < randomcommas
102505 L2_LD:M:E:S:I
   167 L2_ST:M:E:S:I
$ pfmon -e L2_LD:M:E:S:I,L2_ST:M:E:S:I python -Sc "import sys; print sum(l.count(',') for l in sys.stdin)" < ./randomcommas
3278774 L2_LD:M:E:S:I
  10457 L2_ST:M:E:S:I

This shows us that the Python version does quite a few more stores than the C counterpart. Considering this program should simply be reading the input stream and counting the number of commas, we do not expect much store traffic at all. This suggests the Python version is doing some extra copying, for whatever reason (maybe some Python expert can pinpoint it?).

We can drill down a bit more into the memory related latencies. The DCU_LINES_IN event gives the total number of lines allocated in the cache. Another event, DCU_MISS_OUTSTANDING, gives a weighted measure of the cycles spent waiting for a cache line to be brought in. Each cycle spent waiting is weighted by the number of outstanding cache misses (I think the Pentium M I'm using can have up to 4 cache miss requests outstanding at once) and has some caveats, but can be considered a rough estimate of the time spent waiting for a cache line to be brought in. Therefore divding DCU_MISS_OUTSTANDING by DCU_LINES_IN gives us an approximate metric of how long a cache miss takes.

$ pfmon -e DCU_MISS_OUTSTANDING,DCU_LINES_IN ./comma < randomcommas
769736 DCU_MISS_OUTSTANDING
102387 DCU_LINES_IN

$ pfmon -e DCU_MISS_OUTSTANDING,DCU_LINES_IN python -Sc "import sys; print sum(l.count(',') for l in sys.stdin)" < ./randomcommas
99810150 DCU_MISS_OUTSTANDING
 4240179 DCU_LINES_IN

So that works out to 7.5 cycles for the C version and 23 cycles for the Python version. This seems to strongly suggest that it is memory traffic that is weighing the Python version down.

That is only the initial phase; the results give a high level idea of why one program is running slower than the other. The initial analysis phase generally consists of taking the ratios of certain events to try and get some idea in your head of what the program is doing. Then comes the really hard work; drilling down to figure out how to fix it!

Some useful references:

Fun with -funroll-loops

I was playing with loop unrolling, and decided to investigate it a little. The basis is this very simple program which looks like it could do with some loop unrolling.

#include <stdio.h>
#include <stdlib.h>
#include <assert.h>

#define SIZE (1500 * 1024 * 1024)

int fn(int *buf) {
        int i;

    for(i=0; i < (SIZE/sizeof(int)); i+=1)
        buf[i] = i;

    return 0;
}

int main(void)
{
        int *buf = malloc(SIZE);
        assert(buf);
    return fn(buf);
}

Firstly, lets have a look at what happens to the function when -funroll-loops is applied. Below is the de-compilation with some comments on what each line is doing.

Non-optimised

                         | nop.m 0x0
r14=0                    | mov r14=r0
save the "loop counter"  | mov.i r2=ar.lc
                         | nop.m 0x0
one less than iterations | movl r15=0x176fffff;;
                         | nop.m 0x0
initalise loop counter   | mov.i ar.lc=r15
                         | nop.i 0x0;;
                         | loop:
*buf = i, buf++          | st4 [r32]=r14,4
i++                      | adds r14=1,r14
dec lc, branch if > 0    | br.cloop.sptk.few .loop
                         | nop.m 0x0
restore loop counter     | mov.i ar.lc=r2

Loop unrolled

                         | nop.m 0x0
r26 = 0                  | mov r26=r0
save lc                  | mov.i r2=ar.lc
                         | nop.m 0x0
iter / 32                | movl r14=0x2edffff;;
                         | nop.m 0x0
setup loop counter       | mov.i ar.lc=r14
                         | nop.i 0x0
                         | loop:
r3 = buf                 | mov r3=r32
r8 = 1                   | adds r8=1,r26
r25 = 3                  | adds r25=3,r26
r23 = buf[3]             | adds r23=12,r32
r24 = 4                  | adds r24=4,r26
r22 = buf[4]             | adds r22=16,r32;;
buf[0] = 0; r3=buf+1     | st4 [r3]=r26,4
r21 = 5                  | adds r21=5,r26
r19 = buf[5]             | adds r19=20,r32
r20 = 6                  | adds r20=6,r26
r18 = buf[6]             | adds r18=24,r32
r16 = 7                  | adds r16=7,r26;;
                         | nop.m 0x0
buf[1] = 1, r3=buf+2     | st4 [r3]=r8,4
r15 = buf[7]             | adds r15=28,r32
r17 = 2                  | adds r17=1,r8
r26 += 8                 | adds r26=8,r26
buf += 8 (for next iter) | adds r32=32,r32;;
buf[2] = 2               | st4 [r3]=r17
buf[3] = 3               | st4 [r23]=r25
                         | nop.i 0x0
buf[4] = 4               | st4 [r22]=r24
buf[5] = 5               | st4 [r19]=r21
                         | nop.i 0x0
buf[6] = 6               | st4 [r18]=r20
buf[7] = 7               | st4 [r15]=r16
loop, dec branch         | br.cloop.sptk.few .loop
                         | nop.m 0x0
restore lc               | mov.i ar.lc=r2
                         | br.ret.sptk.many b0;;

We can see that in the first case the loop counter is setup to run 393216000 times (e.g. 1500*1024*1024/sizeof(int)) and a very simple loop of storing the value and incrementing is undertaken. In the second version, the code becomes more complex. We can see the loop now executes 49152000 times (e.g. 1500*1024*1024/sizeof(int)/8) so we can infer that for each loop iteration, 8 values have been unrolled to be written into our buf array. Indeed, when pulled apart we can see the 8 stores (numbers just reflect the first time through).

So, is it faster?

$ time ./loop

real    0m1.209s
user    0m0.388s
sys     0m0.820s

$ timme ./loop-unroll

real    0m1.056s
user    0m0.244s
sys     0m0.812s

Yes! Great. We can suggest a number of reasons why, but it would be interesting to get some hard statistics on why this is so. Thanks to the Itanium performance counters, we can. Firstly, lets start by seeing how cycles are being spent.

$ pfmon -e cpu_cycles,ia64_inst_retired_this,nops_retired,back_end_bubble_all ./loop
 547923609 CPU_CYCLES
1179995250 IA64_INST_RETIRED_THIS
    104431 NOPS_RETIRED
 154285534 BACK_END_BUBBLE_ALL

$ pfmon -e cpu_cycles,ia64_inst_retired_this,nops_retired,back_end_bubble_all ./loop-unroll
 311570590 CPU_CYCLES
1327451286 IA64_INST_RETIRED_THIS
 147560435 NOPS_RETIRED
  16088889 BACK_END_BUBBLE_ALL

Now, the Itanium can issue up to six instructions (IA64_INST_RETIRED_THIS) in two bundles of three instructions per cycle (CPU_CYCLES). However, you can't have dependencies between registers within a 3-instruction bundle (and branches and interruptions play havoc) so sometimes you need to pad with no-ops (this is why you need a good compiler). We can work out some figures from this, namely the useful instructions per cycle (e.g. instructions retired - nop instructions / cycles).

Test Useful instructions/cycle
loop 1179995250 - 104431 / 547923609 = 2.15
unroll 1327451286 - 147560435 / 311570590 = 3.78

This tells us that for each given cycle, the unrolled-loop version is doing more work (ideally we'd like that to be a the theoretical maximum of 6). So what is the unrolled version doing for all this time? Bubbles are where the CPU is waiting for something; a prime candidate is moving data from caches to registers. Bubbles make up (154285534/547823609) 28% of the cycles on the loop version, but only (16088889/311570590) 5% of the time for the unrolled version. This means the processor is spending a lot less time waiting for things to happen with the unrolled loop version.

We can drill down further to see what bubbles are occurring.

$ pfmon -e be_l1d_fpu_bubble_all,be_exe_bubble_all,be_RSE_bubble_all,Back_end_bubble_fe ./loop
 14229581 BE_L1D_FPU_BUBBLE_ALL
    97669 BE_EXE_BUBBLE_ALL
     1260 BE_RSE_BUBBLE_ALL
131354866 BACK_END_BUBBLE_FE

$ pfmon -e be_l1d_fpu_bubble_all,be_exe_bubble_all,be_RSE_bubble_all,Back_end_bubble_fe ./loop-unroll
22676169 BE_L1D_FPU_BUBBLE_ALL
   83064 BE_EXE_BUBBLE_ALL
    1263 BE_RSE_BUBBLE_ALL
  718850 BACK_END_BUBBLE_FE

We are now breaking the stalls down to see where they are occuring. L1D_FPU_BUBBLES are essentially related to micro-architectural issues with the caches; things like the L1D cache being overwhelmend and interactions with the hardware page-table walker. BE_EXE bubbles are more simply described a waiting for data to come from caches (or even main memory) to registers. BE_RSE bubbles are related to the register stack engine, and "front end" bubbles (BACK_END_BUBBLE_FE) are where there are not enough instructions coming from the "front-end" for the "back-end" to issue out to functional units in the processor.

In this case, the major cause of problems for the simple loop seems to be not being able to get enough instructions through to keep the processor busy. We can try to pin down what is happening in the front-end:

$ pfmon -e fe_bubble_imiss,fe_bubble_tlbmiss,fe_bubble_branch,fe_bubble_bubble ./loop
   27727 FE_BUBBLE_IMISS
    4910 FE_BUBBLE_TLBMISS
98094189 FE_BUBBLE_BRANCH
52615907 FE_BUBBLE_BUBBLE

$ pfmon -e fe_bubble_imiss,fe_bubble_tlbmiss,fe_bubble_branch,fe_bubble_bubble ./loop-unroll
780729 FE_BUBBLE_IMISS
  4858 FE_BUBBLE_TLBMISS
291620 FE_BUBBLE_BRANCH
111089 FE_BUBBLE_BUBBLE

What we can see here is that the increased code size of the unrolled version causes us a lot more i-cache misses, as expected. However, the problem for the unrolled version seems to be the time spent by the front-end dealing with the branch. This is not surprising since there is a rumor that there is a front-end buffer which fills up after 3 repeated cycles with branch instructions; apparently this is a problem addressed in the new Montecito chips (if anyone has one, I'll update this if you send me the numbers). Since we are doing 393216000 branches all within a single bundle its not surprising we've hit it!

Just to confirm, we can break-down the BE_EXE bubbles. Remember, BE_EXE bubbles are caused by stalls in the execution phase primarily due to cache latencies or inter-register dependencies. Looking at our code, we don't re-use the same register over-and-over so we would not expect to spend a long time waiting for registers, and indeed this is what we see.

$ pfmon -e be_exe_bubble_grall,be_exe_bubble_grgr ./loop
79601 BE_EXE_BUBBLE_GRALL
  919 BE_EXE_BUBBLE_GRGR

$ pfmon -e be_exe_bubble_grall,be_exe_bubble_grgr ./loop-unroll
76627 BE_EXE_BUBBLE_GRALL
  918 BE_EXE_BUBBLE_GRGR

Therefore in this case, the speed increase isn't coming from better cache behaviour as we might have expected, but greater ability to keep the processor busy with instructions between branches.

We can also examine the major events happening with the unrolled case. Here we see BE_L1D_FPU bubbles being the major overhead. On Itanium floating-point avoids the L1 cache (it is too big, and not re-used enough to make it useful) hence the concatenation of the event acronym. These bubbles can be broken down into the following events (measured in two runs, since you can only do 4 at a time).

$ pfmon -e be_l1d_fpu_bubble_l1d,be_l1d_fpu_bubble_l1d_dcurecir,\
  be_l1d_fpu_bubble_l1d_tlb,be_l1d_fpu_bubble_l1d_stbufrecir ./loop-unroll
 9623193 BE_L1D_FPU_BUBBLE_L1D_DCURECIR
     414 BE_L1D_FPU_BUBBLE_L1D_TLB
     282 BE_L1D_FPU_BUBBLE_L1D_STBUFRECIR
$ pfmon -e be_l1d_fpu_bubble_l1d_fullstbuf,\
    be_l1d_fpu_bubble_l1d_l2bpress,be_l1d_fpu_bubble_l1d_tlb ./loop-unroll
      23 BE_L1D_FPU_BUBBLE_L1D_FULLSTBUF
17220177 BE_L1D_FPU_BUBBLE_L1D_L2BPRESS
     425 BE_L1D_FPU_BUBBLE_L1D_TLB

These events expose micro-architectural details, the full extent of which is only gleaned by reading the processor manuals (a PhD in computer architecture probably helps too!). The store buffers are not an issue here -- the caches are more than able to keep up with our few writes. The TLB is also not involved; we have pretty good TLB coverage thanks to the virtual-linear page table and hardware page-table walker.

The two clues are DCURECIR and L2BPRESS. Essentially DCURECIR happens when references have to "re-circulate"; this is a side-effect of the data not being available. The L2BPRESS figure suggests why this is so; this event happens when the L2 cache can not handle any more requests. The L2 cache keeps a queue of outstanding requests; when this queue is full (for example, full of long latency requests to get data from main memory) the L2 cache causes "back-pressure" which stops the L1 cache from issuing new requests. This suggests the program is chewing through a lot of data and not using the cache very effectively, which is exactly what we are doing. Pre-fetching hints can help (but as described in a previous entry on hacking Enigma may not always help), but in this case there probably isn't any spare bandwidth to pre-fetch in because essentially no processing is happening.

What does all this mean? I don't know, but playing with performance monitors is fun!

Set-bit Population Counts

We were visiting our friends at HP yesterday, and whilst discussing some of the Itanium product line plans, the comment that certain TLA's have a real sweet spot for Itanium because it can tell them the number of set bits in a word very quickly. I was aware of the popcnt instruction, but wasn't aware people were buying machines to use it.

I instrumented some code to run a test -- one using the GCC built-in (which falls through to the popcnt instruction on Itanium), one using a re-implementation of the generic GCC version, and one described in the excellent "Algorithms for programmers" book by Jörg Arndt (download it now if you don't have it!).

A naive implementation would do it with 64 shifts, which would take forever (for a fairly good explanation of why shifting takes so long, see the patent on optimised bit-shifting). The gcc built-in way is a clever hack:

const int count_table[256] =
{
    0,1,1,2,1,2,2,3,1,2,2,3,2,3,3,4,1,2,2,3,2,3,3,4,2,3,3,4,3,4,4,5,
    1,2,2,3,2,3,3,4,2,3,3,4,3,4,4,5,2,3,3,4,3,4,4,5,3,4,4,5,4,5,5,6,
    1,2,2,3,2,3,3,4,2,3,3,4,3,4,4,5,2,3,3,4,3,4,4,5,3,4,4,5,4,5,5,6,
    2,3,3,4,3,4,4,5,3,4,4,5,4,5,5,6,3,4,4,5,4,5,5,6,4,5,5,6,5,6,6,7,
    1,2,2,3,2,3,3,4,2,3,3,4,3,4,4,5,2,3,3,4,3,4,4,5,3,4,4,5,4,5,5,6,
    2,3,3,4,3,4,4,5,3,4,4,5,4,5,5,6,3,4,4,5,4,5,5,6,4,5,5,6,5,6,6,7,
    2,3,3,4,3,4,4,5,3,4,4,5,4,5,5,6,3,4,4,5,4,5,5,6,4,5,5,6,5,6,6,7,
    3,4,4,5,4,5,5,6,4,5,5,6,5,6,6,7,4,5,5,6,5,6,6,7,5,6,6,7,6,7,7,8
};

static inline unsigned long countit_table(unsigned long x) {
  int i, ret = 0;

  for (i = 0; i < 64; i += 8)
    ret += count_table[(x >> i) & 0xff];

  return ret;
}

The results I saw, in cycles, were:

Algorithm 2Ghz AMD Opteron 270 1.5Ghz Itanium2
Built in 30 6
Table lookup 45 27
Shifting 60 48

The AMD GCC built-in seems to create some slightly tighter code than my extract table lookup version -- it doesn't unroll the loop and I assume the cache does a good job of the prediction. But if your applications rely on finding set bits heavily, then Itanium is the platform for you!

IA32 segments and fast system calls

I've previously mentioned the gate page on Linux, but I thought a little more information might be useful.

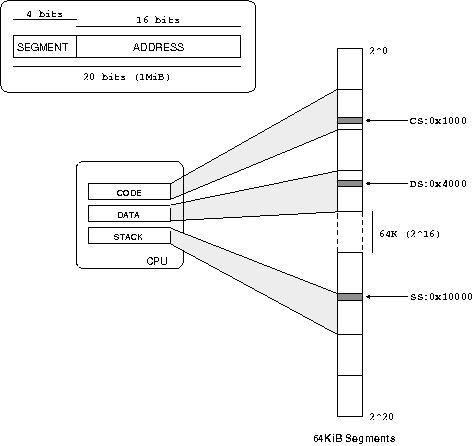
The reason why system calls are so slow on x86 goes back to the ingenious but complicated segmentation scheme used by the processor. The original reason for segmentation was to be able to use more than the 16 bits available in a register for an address, as illustrated below.

Segmentation with 64KiB segments

When x86 moved to 32 bit registers, the segmentation scheme remained but in a different format.

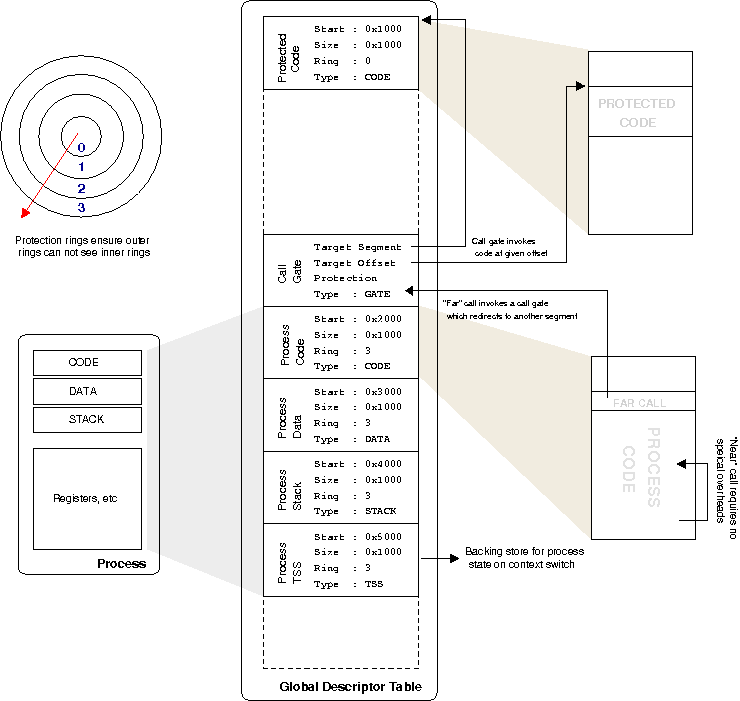
Rather than fixed segment sizes, segments are allowed to be any size. This means the processor needs to keep track of all these different segments and their sizees, which it does descriptors. The segment descriptors available to everyone are kept in the global descriptor table or GDT for short. Each process has a number of registers which point to entries in the GDT; these are the segments the process can access (there are also local descriptor tables, and it all interacts with task state segments, but that's not important now).

The situation is illustrated below.

Segmentation in a 32 bit x86 system

Since the processor knows what segments of memory the currently running process can access, it can enforce protection and ensure the process doesn't touch anything it is not supposed to. If it does go out of bounds, you receive a segmentation fault, which most programmers are familiar with.

The interesting bit comes when you want to make calls into code that resides in another segment. To implement a secure system, we can give segments a certain permission value. x86 does this with rings, where ring 0 is the highest permission, ring 3 is the lowest, and inner rings can access outer rings but not vice-versa.

Like any good nightclub, once you're inside "club ring 0" you can do anything you want. Consequently there's a bouncer on the door, in the form of a call gate. When ring 3 code wants to jump into ring 0 code, you have to go through the call gate. If you're on the door list, the processor gets bounced to a certain offset of code within the ring 0 segment.

This allows a whole hierarchy of segments and permissions between them. You might have noticed a cross segment call sounds exactly like a system call. If you've ever looked at Linux x86 assembly the standard way to make a system call is int 0x80, which raises interrupt 0x80. An interrupt stops the processor and goes to an interrupt gate, which then works the same as a call gate -- it bounces you off to some other area of code assuming you are allowed.

The problem with this scheme is that it is slow. It takes a lot of effort to do all this checking, and many registers need to be saved to get into the new code. And on the way back out, it all needs to be restored again.

On a modern system, the only thing that really happens with all this fancy segmentation switching is system calls, which essentially switch from mode 3 (userspace) to mode 0 and jump to the system call handler code inside the kernel. Thus sysenter (and sysexit to get back) speed up the whole process over an int 0x80 call by removing the general nature of a far call (i.e. the possibility of going to any segment, with any ring level) and restricting you to going to ring 0 code at a specific segment and offset, as stored in registers.

Because there are so many less options, the whole process can be speed up, and hence we have a fast system call. The other thing to note is that state is not preserved when the kernel gets control. The kernel has to be careful to not to destory state, but it also means it is free to only save as little state as is required to do the job, so can be much more efficient about it. If you're thinking "wow that sounds like insert favourite RISC processor", you're probably right.

The x86 truly is a weird and wonderful machine!