Also titled minimal images - maximal effort!
The OpenStack Infrastructure Team manages a large
continuous-integration system that provides the broad range of testing
the OpenStack project requires. Tests are run thousands of times a
day across every project, on multiple platforms and on multiple
cloud-providers. There are essentially no manual steps in any part of
the process, with every component being automated via scripting, a few
home-grown tools and liberal doses of Puppet and Ansible. More
importantly, every component resides in the public git trees right
alongside every other OpenStack project, with contributions actively
encouraged.
As with any large system, technical debt can build up and start to
affect stability and long-term maintainability. OpenStack
Infrastructure can see some of this debt accumulating as more testing
environments across more cloud-providers are being added to support
ever-growing testing demands. Thus a strong focus of recent work has
been consolidating testing platforms to be smaller, better defined and
more maintainable. This post illustrates some of the background to
the issues and describes how these new platforms are more reliable and
maintainable.
OpenStack CI Overview
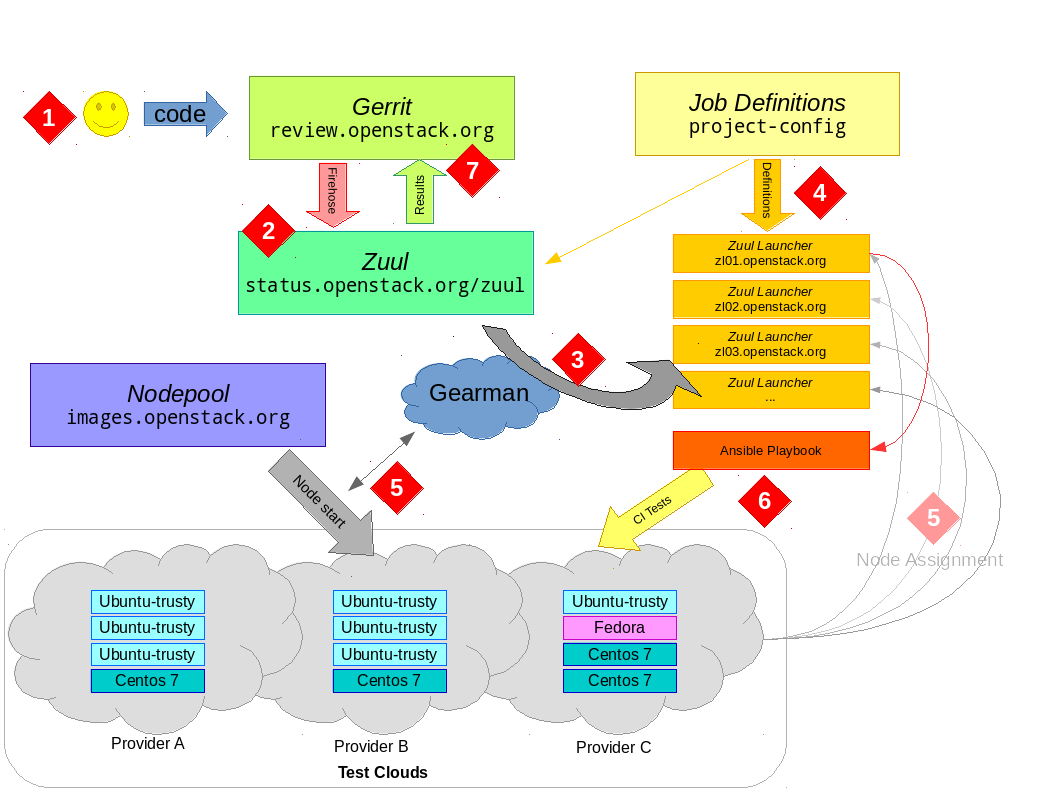
Before getting into details, it's a good idea to get a basic
big-picture conceptual model of how OpenStack CI testing works. If
you look at the following diagram and follow the numbers with the
explanation below, hopefully you'll have all the context you need.

The developer uploads their code to gerrit via the
git-review tool. There is no further action required on their
behalf and the developer simply waits for results.
Gerrit provides a JSON-encoded "firehose" output of everything
happening to it. New reviews, votes, updates and more all get sent
out over this pipe. Zuul is the overall scheduler
that subscribes itself to this information and is responsible for
managing the CI jobs appropriate for each change.
Zuul has a configuration
that tells it what jobs to run for what projects. Zuul can do lots
of interesting things, but for the purposes of this discussion we
just consider that it puts the jobs it wants run into gearman
for a Jenkins master to consume. gearman
is a job-server; as they explain it "[gearman] provides a generic
application framework to farm out work to other machines or
processes that are better suited to do the work". Zuul puts into
gearman basically a tuple (job-name, node-type) for each
job it wants run, specifying the unique job name to run and what
type of node it should be run on.
A group of Jenkins masters are subscribed
to gearman as workers. It is these Jenkins masters that will
consume the job requests from the queue and actually get the tests
running. However, Jenkins needs two things to be able to run a job
— a job definition (what to actually do) and a slave node
(somewhere to do it).
The first part — what to do — is provided by job-definitions
stored in external YAML files and processed by Jenkins Job Builder (jjb)
in to job configurations for Jenkins. Each Jenkins master gets
these definitions pushed to it constantly by Puppet, thus each
Jenkins master instance knows about all the jobs it can run
automatically. Zuul also knows about these job definitions; this
is the job-name part of the tuple we said it put into
gearman.
The second part — somewhere to run the test — takes some more
explaining. To the next point...
Several cloud companies donate capacity in their clouds for
OpenStack to run CI tests. Overall, this capacity is managed by a
customised orchestration tool called nodepool.
Nodepool watches the gearman queue and sees what requests are
coming out of Zuul. It looks at node-type of jobs in the queue
and decides what types of nodes need to start and which cloud
providers have capacity to satisfy demand. Nodepool will monitor
the start-up of the virtual-machines and register the new nodes to
the Jenkins master instances.
At this point, the Jenkins master has what it needs to actually get
jobs started. When nodepool registers a host to a Jenkins master
as a slave, the Jenkins master can now advertise its ability to
consume jobs. For example, if a ubuntu-trusty node is provided
to the Jenkins master instance by nodepool, Jenkins can now consume
from gearman any job it knows about that is intended to run on
an ubuntu-trusty slave. Jekins will run the job as defined in
the job-definition on that host — ssh-ing in, running scripts,
copying the logs and waiting for the result. (It is a gross
oversimplification, but for the purposes of OpenStack CI, Jenkins
is pretty much used as a glorified ssh/scp wrapper. Zuul Version
3, under development, is working to remove the need for Jenkins to
be involved at all. 2016-06 Jenkins has been removed from the
OpenStack CI pipeline and largely replaced with Ansible. For
details see this post).
Eventually, the test will finish. The Jenkins master will put the
result back into gearman, which Zuul will consume. The slave
will be released back to nodepool, which destroys it and starts all
over again (slaves are not reused and also have no sensitive
details on them, as they are essentially publicly accessible).
Zuul will wait for the results of all jobs for the change and post
the result back to Gerrit; it either gives a positive vote or the
dreaded negative vote if required jobs failed (it also handles
merges to git, but we'll ignore that bit for now).
In a nutshell, that is the CI work-flow that happens
thousands-upon-thousands of times a day keeping OpenStack humming
along.
Image builds
So far we have glossed over how nodepool actually creates the images
that it hands out for testing. Image creation, illustrated in step
8 above, contains a lot of important details.
Firstly, what are these images and why build them at all? These
images are where the "rubber hits the road" — they are instantiated
into the virtual-machines that will run DevStack, unit-testing or
whatever else someone might want to test.
The main goal is to provide a stable and consistent environment in
which to run a wide-range of tests. A full OpenStack deployment
results in hundreds of libraries and millions of lines of code all
being exercised at once. The testing-images are right at the bottom
of all this, so any instability or inconsistency affects everyone;
leading to constant fire-firefighting and major inconvenience as all
forward-progress stops when CI fails. We want to support a wide
number of platforms interesting to developers such as Ubuntu, Debian,
CentOS and Fedora, and we also want to and make it easy to handle new
releases and add other platforms. We want to ensure this can be
maintained without too much day-to-day hands-on.
Caching is a big part of the role of these images. With thousands of
jobs going on every day, an occasional network blip is not a minor
annoyance, but creates constant and difficult to debug failures. We
want jobs to rely on as few external resources as possible so tests
are consistent and stable. This means caching things like the git
trees tests might use (OpenStack just broke the 1000 repository mark),
VM images, packages and other common bits and pieces. Obviously a
cache is only as useful as the data in it, so we build these images up
every day to keep them fresh.
Snapshot images
If you log into almost any cloud-provider's interface, they almost
certainly have a range of pre-canned images of common distributions
for you to use. At first, the base images for OpenStack CI testing
came from what the cloud-providers had as their public image types.
However, over time, there are a number of issues that emerge:
- No two images, even for the same distribution or platform, are the
same. Every provider seems to do something "helpful" to the images
which requires some sort of workaround.
- Providers rarely leave these images alone. One day you would boot
the image to find a bunch of Python libraries pip-installed, or a
mount-point moved, or base packages removed (all happened).
- Even if the changes are helpful, it does not make for consistent
and reproducible testing if every time you run, you're on a
slightly different base system.
- Providers don't have some images you want (like a latest Fedora),
or have different versions, or different point releases. All
update asynchronously whenever they get around to it.
So the original incarnations of OpenStack CI images were based on
these public images. Nodepool would start one of these provider
images and then run a series of scripts on it — these scripts would
firstly try to work-around any quirks to make the images look as
similar as possible across providers, and then do the caching, setup
things like authorized keys and finish other configuration tasks.
Nodepool would then snapshot this prepared image and start
instantiating VM's from these snapshots into the pool for testing. If
you hear someone talking about a "snapshot image" in OpenStack CI
context, that's likely what they are referring to.
Apart from the stability of the underlying images, the other issue you
hit with this approach is that the number of images being built starts
to explode when you take into account multiple providers and multiple
regions. Even with just Rackspace and the (now defunct) HP Cloud we
would end up creating snapshot images for 4 or 5 platforms across a
total of about 8 regions — meaning anywhere up to 40 separate image
builds happening daily (you can see how ridiculous it was getting in
the logging configuration
used at the time). It was almost a fait accompli that some of these
would fail every day — nodepool can deal with this by reusing old
snapshots — but this leads to a inconsistent and heterogeneous testing
environment.
Naturally there was a desire for something more consistent — a single
image that could run across multiple providers in a much more tightly
controlled manner.
Upstream-based builds
Upstream distributions do provide "cloud-images", which are usually
pre-canned .qcow2 format files suitable for uploading to your
average cloud. So the diskimage-builder tool was
put into use creating images for nodepool, based on these
upstream-provided images. In essence, diskimage-builder uses a
series of elements (each, as the name suggests, designed to do one
thing) that allow you to build a completely customised image. It
handles all the messy bits of laying out the image file, tries to be
smart about caching large downloads and final things like conversion
to qcow2 or vhd.
nodepool has used diskimage-builder to create customised images
based upon the upstream releases for some time. These are better, but
still have some issues for the CI environment:
- You still really have no control over what does or does not go into
the upstream base images. You don't notice a change until you
deploy a new image based on an updated version and things break.
- The images still start with a fair amount of "stuff" on them. For
example cloud-init is a rather large Python program and has a
fair few dependencies. These dependencies can both conflict with
parts of OpenStack or end up tacitly hiding real test requirements
(the test doesn't specify it, but the package is there as part of
another base dependency. Things then break when the base
dependencies change). The whole idea of the CI is that (as much as
possible) you're not making any assumptions about what is required
to run your tests — you want everything explicitly included.
- An image that "works everywhere" across multiple cloud-providers is
quite a chore. cloud-init hasn't always had support for
config-drive and Rackspace's DHCP-less environment, for
example. Providers all have their various different networking
schemes or configuration methods which needs to be handled
consistently.
If you were starting this whole thing again, things like LXC/Docker to
keep "systems within systems" might come into play and help alleviate
some of the packaging conflicts. Indeed they may play a role in the
future. But don't forget that DevStack, the major CI deployment
mechanism, was started before Docker existed. And there's tricky
stuff with networking and Neutron going on. And things like iSCSI
kernel drivers that containers don't support well. And you need to
support Ubuntu, Debian, CentOS and Fedora. And you have hundreds of
developers already relying on what's there. So change happens
incrementally, and in the mean time, there is a clear need for a
stable, consistent environment.
Minimal builds
To this end, diskimage-builder now has a serial of "minimal"
builds that are really that — systems with essentially nothing on
them. For Debian and Ubuntu this is achieved via debootstrap, for
Fedora and CentOS we replicate this with manual installs of base
packages into a clean chroot environment. We add on a range of
important elements that make the image useful; for example, for
networking, we have simple-init
which brings up the network consistently across all our providers but
has no dependencies to mess with the base system. If you check the
elements
provided by project-config you can see a range of specific elements
that OpenStack Infra runs at each image build (these are actually
specified by in arguments to nodepool, see the config file,
particularly diskimages section). These custom elements do things
like caching, using puppet to install the right authorized_keys
files and setup a few needed things to connect to the host. In
general, you can see the logs of an image build provided by nodepool for each daily build.
So now, each day at 14:14 UTC nodepool builds the daily images that
will be used for CI testing. We have one image of each type that
(theoretically) works across all our providers. After it finishes
building, nodepool uploads the image to all providers (p.s. the
process of doing this is so insanely terrible it spawned shade; this deserves many posts
of its own) at which point it will start being used for CI jobs. If
you wish to replicate this entire process, the build-image.sh
script, run on an Ubuntu Trusty host in a virtualenv with
diskimage-builder will get you pretty close (let us know of any
issues!).
DevStack and bare nodes
There are two major ways OpenStack projects test their changes:
- Running with DevStack, which brings up
a small, but fully-functional, OpenStack cloud with the
change-under-test applied. Generally tempest is then used to ensure
the big-picture things like creating VM's, networks and storage are
all working.
- Unit-testing within the project; i.e. what you do when you type
tox -e py27 in basically any OpenStack project.
To support this testing, OpenStack CI ended up with the concept of
bare nodes and devstack nodes.
- A bare node was made for unit-testing. While tox has plenty
of information about installing required Python packages into the
virtualenv for testing, it doesn't know anything about the
system packages required to build those Python packages. This
means things like gcc and library -devel packages which many
Python packages use to build bindings. Thus the bare nodes had an
ever-growing and not well-defined list of packages that were
pre-installed during the image-build to support unit-testing. Worse
still, projects didn't really know their dependencies but just
relied on their testing working with this global list that was
pre-installed on the image.
- In contrast to this, DevStack has always been able to bootstrap
itself from a blank system to a working OpenStack deployment by
ensuring it has the right dependencies installed. We don't want any
packages pre-installed here because it hides actual dependencies
that we want explicitly defined within DevStack — otherwise, when a
user goes to deploy DevStack for their development work, things
break because their environment differs slightly to the CI one. If
you look at all the job definitions in OpenStack, by convention any
job running DevStack has a dsvm in the job name — this referred
to running on a "DevStack Virtual Machine" or a devstack node. As
the CI environment has grown, we have more and more testing that
isn't DevStack based (puppet apply tests, for example) that rather
confusingly want to run on a devstack node because they do not
want dependencies installed. While it's just a name, it can be
difficult to explain!
Thus we ended up maintaining two node-types, where the difference
between them is what was pre-installed on the host — and yes, the
bare node had more installed than a devstack node, so it wasn't
that bare at all!
Specifying Dependencies
Clearly it is useful to unify these node types, but we still need to
provide a way for the unit-test environments to have their
dependencies installed. This is where a tool called bindep comes in. This tool
gives project authors a way to specify their system requirements in a
similar manner to the way their Python requirements are kept. For
example, OpenStack has the concept of global requirements — those
Python dependencies that are common across all projects so version
skew becomes somewhat manageable. This project now has some extra
information in the other-requirements.txt
file, which lists the system packages required to build the Python
packages in the global-requirements list.
bindep knows how to look at these lists provided by projects and
get the right packages for the platform it is running on. As part of
the image-build, we have a cache-bindep
element that can go through every project and build a list of the
packages it requires. We can thus pre-cache all of these packages
onto the images, knowing that they are required by jobs. This both
reduces the dependency on external mirrors and improves job
performance (as the packages are locally cached) but doesn't pollute
the system by having everything pre-installed.
Package installation can now happen via the way we really should be
doing it — as part of the CI job. There is a job-macro called
install-distro-packages
which a test can use to call bindep to install the packages
specified by the project before the run. You might notice the script
has a "fallback" list of packages if the project does not specify it's
own dependencies — this essentially replicates the environment of a
bare node as we transition to projects more strictly specifying
their system requirements.
We can now start with a blank image and all the dependencies to run
the job can be expressed by and within the project — leading to a
consistent and reproducible environment without any hidden
dependencies. Several things have broken as part of removing bare
nodes — this is actually a good thing because it means we have
revealed areas where we were making assumptions in jobs about what the
underlying platform provides. There's a few other job-macros that can
do things like provide MySQL/Postgres instances for testing or setup
other common job requirements. By splitting these types of things out
from base-images we also improve the performance of jobs who don't
waste time doing things like setting up databases for jobs that don't
need it.
As of this writing, the bindep work is new and still a
work-in-progress. But the end result is that we have no more need for
a separate bare node type to run unit-tests. This essentially
halves the number of image-builds required and brings us to the goal
of a single image for each platform running all CI.
Conclusion
While dealing with multiple providers, image-types and dependency
chains has been a great effort for the infra team, to everyone's
credit I don't think the project has really noticed much going on
underneath.
OpenStack CI has transitioned to a situation where there is a single
image type for each platform we test that deploys unmodified across
all our providers and runs all testing environments equally. We have
better insight into our dependencies and better tools to manage them.
This leads to greatly decreased maintenance burden, better consistency
and better performance; all great things to bring to OpenStack CI!