I think the old-fashioned coredump is a little under-appreciated these days. I'm not sure when it changed, but I even had to add myself to /etc/security/limits.conf to raise my ulimit to even create one.
Anyway, debugging __thread variables from coredumps is a bit of a pain. For the uninitiated, the __thread identifier specifies a thread-local variable, i.e. every thread gets its own copy of the variable automatically.
The implementation of this is highly architecture specific. The reason is that TLS entries need to be accessed via a register kept as part of the thread state, and thus every architecture chooses their own register and builds their own ABI. On x86-32, which is very register-limited, you certainly don't want to dedicate a register to a pointer to TLS variables and take it out of operation. Luckily there is the hang-over from the 70's (60's? 50's?) — segmentation. Without going into real detail, segment registers can be used to offset into a region of memory based on a look-up of a region descriptor stored in a table.
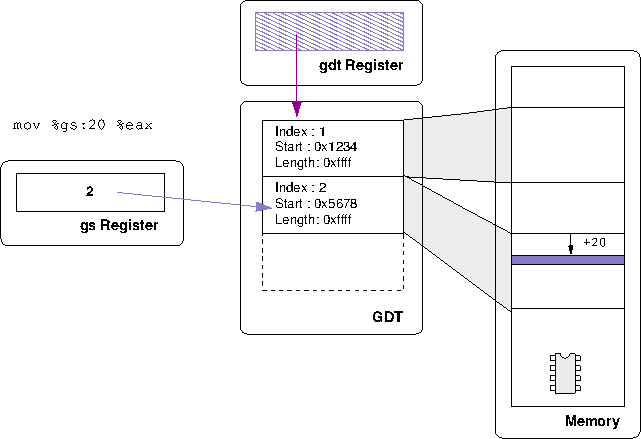
Above, you see a simplified example of the %gs register loaded with the index value 2, and thus when you access %gs:20 what you are saying is "find entry 2 in the global descriptor table (GDT), follow it and offset 20 into that region.
The kernel gives each thread its own GDT (i.e. the GDT register is part of the thread-state). Thus __thread variables are stored based on segment offsets and — voila — thread-local storage. Now, there's a few tricks here. For various reasons, a process can not setup entries in the GDT; this is a privileged operation that must be done by the kernel. There is actually a special system call for threads to setup their TLS areas in the GDT — set_thread_area. When a new thread starts, the thread-library and dynamic linker conspire to allocate and load any static TLS data (i.e. if you have a global __thread variable initialised to some value, then every thread must see that value when it starts) and then calls this to make sure the variables are ready to go. After that, the gs register is filled with the index of that GDT entry, and all TLS access goes via it. That, in a nut-shell, is TLS for x86-32.
Now, to the problem. Take, for example, the following short program:
#include <stdio.h>
#include <stdlib.h>
#include <unistd.h>
#include <pthread.h>

int __thread foo;

void* thread(void *in) {

        foo = (int)in;

        printf("foo is %d\n", foo);

        while (1) {
                sleep(10);
        }
}

int main(void) {

        pthread_t threads[5];
        int i;

        for (i=0; i<5; i++) {
                pthread_create(&threads[i], NULL,
                               thread, (void*)i);
        }

        sleep(5);
        abort();
}
We start a few threads and then abort to make it dump core. But, if you try and examine foo:
$ gdb ./thread core
GNU gdb (GDB) 7.2-debian
Reading symbols from /home/ianw/tmp/thread/thread...done.
[New Thread 4970]
[New Thread 4975]
[New Thread 4974]
[New Thread 4973]
[New Thread 4972]
[New Thread 4971]

Core was generated by `./thread'.
Program terminated with signal 6, Aborted.
#0  0xffffe424 in __kernel_vsyscall ()
(gdb) print foo
Cannot find thread-local variables on this target
It seems that gdb doesn't know how to find the value of foo because its not a variable in the usual sense ("this target", in this case, means a coredump). It relies on accessing via the gs register, which relies on the current processes' GDT state, which has since been destroyed. If you care to consult the canonical source of TLS info, you can find out exactly why this is so hard to figure out generically. However, with some work, we can start to figure out the value by hand.
A coredump is really a ELF file full of just two things: a bunch of LOAD segments that are just dumps of the process memory regions, and a NOTE section that includes a bunch of notes that the kernel dumps out for us such as the current register state, the process id, the signal that killed us, etc. Here's an example of a core file under readelf
$ readelf --headers ./core
ELF Header:
  Magic:   7f 45 4c 46 01 01 01 00 00 00 00 00 00 00 00 00
  Class:                             ELF32
...
  OS/ABI:                            UNIX - System V
...
  Type:                              CORE (Core file)
...
There are no sections in this file.

Program Headers:
  Type           Offset   VirtAddr   PhysAddr   FileSiz MemSiz  Flg Align
  NOTE           0x0003d4 0x00000000 0x00000000 0x006b4 0x00000     0
  LOAD           0x001000 0x08048000 0x00000000 0x00000 0x01000 R E 0x1000
  LOAD           0x001000 0x08049000 0x00000000 0x01000 0x01000 RW  0x1000
  LOAD           0x002000 0x0804a000 0x00000000 0x21000 0x21000 RW  0x1000
  LOAD           0x023000 0x46015000 0x00000000 0x00000 0x1b000 R E 0x1000
  LOAD           0x023000 0x46030000 0x00000000 0x01000 0x01000 R   0x1000
  LOAD           0x024000 0x46031000 0x00000000 0x01000 0x01000 RW  0x1000
...
You can examine the notes; with readelf we see:
$ readelf --notes ./core

Notes at offset 0x000003d4 with length 0x000006b4:
  Owner                 Data size      Description
  CORE                 0x00000090      NT_PRSTATUS (prstatus structure)
  CORE                 0x0000007c      NT_PRPSINFO (prpsinfo structure)
  CORE                 0x000000a0      NT_AUXV (auxiliary vector)
  LINUX                0x00000030      Unknown note type: (0x00000200)
  CORE                 0x00000090      NT_PRSTATUS (prstatus structure)
  LINUX                0x00000030      Unknown note type: (0x00000200)
  CORE                 0x00000090      NT_PRSTATUS (prstatus structure)
  LINUX                0x00000030      Unknown note type: (0x00000200)
  CORE                 0x00000090      NT_PRSTATUS (prstatus structure)
  LINUX                0x00000030      Unknown note type: (0x00000200)
  CORE                 0x00000090      NT_PRSTATUS (prstatus structure)
  LINUX                0x00000030      Unknown note type: (0x00000200)
  CORE                 0x00000090      NT_PRSTATUS (prstatus structure)
  LINUX                0x00000030      Unknown note type: (0x00000200)
This shows 5 notes of type NT_PRSTATUS; it should be little surprise that each of these notes describes the process status of one running thread. When gdb pops up [New Thread 4973] that's because it just hit another note that describes the new thread.
To actually make sense of the note, however, we need some other tools that look deeper. The elfutils based tools give us a better description of the various notes in the coredump; more akin to what GDB is interpreting them as. Below I've extracted one thread's info:
$ eu-readelf --notes core
...
  CORE                 144  PRSTATUS
    info.si_signo: 6, info.si_code: 0, info.si_errno: 0, cursig: 6
    sigpend: <>
    sighold: <>
    pid: 4970, ppid: 4960, pgrp: 4970, sid: 4960
    utime: 0.000000, stime: 0.000000, cutime: 0.000000, cstime: 0.000000
    orig_eax: 270, fpvalid: 0
    ebx:           4970  ecx:           4970  edx:              6
    esi:              0  edi:     1176018932  ebp:     0xbfa5b710
    eax:              0  eip:     0xffffe424  eflags:  0x00000206
    esp:     0xbfa5b6f8
    ds: 0x007b  es: 0x007b  fs: 0x0000  gs: 0x0033  cs: 0x0073  ss: 0x007b
  LINUX                 48  386_TLS
    index: 6, base: 0xb6043b70, limit: 0x000fffff, flags: 0x00000051
    index: 7, base: 0x00000000, limit: 0x00000000, flags: 0x00000028
    index: 8, base: 0x00000000, limit: 0x00000000, flags: 0x00000028
What's particularly interesting here is that the note type that was previously unknown (Unknown note type: (0x00000200)) has been resolved for us — it is in fact of type NT_386_TLS and is a dump of the GDT entries for the thread.
So, if we examine how our function is accessing our TLS variable by disassembling the thread function:
(gdb) disassemble thread
Dump of assembler code for function thread:
   0x08048514 <+0>:    push   %ebp
   0x08048515 <+1>:    mov    %esp,%ebp
   0x08048517 <+3>:    sub    $0x18,%esp
   0x0804851a <+6>:    mov    0x8(%ebp),%eax
   0x0804851d <+9>:    mov    %eax,%gs:0xfffffffc
   0x08048523 <+15>:   mov    %gs:0xfffffffc,%edx
   0x0804852a <+22>:   mov    $0x8048670,%eax
   0x0804852f <+27>:   mov    %edx,0x4(%esp)
   0x08048533 <+31>:   mov    %eax,(%esp)
   0x08048536 <+34>:   call   0x80483f4 <printf@plt>
   0x0804853b <+39>:   movl   $0xa,(%esp)
   0x08048542 <+46>:   call   0x8048404 <sleep@plt>
   0x08048547 <+51>:   jmp    0x804853b <thread+39>
Examining the disassembly we can see that foo is accessed via an offset of -4 from %gs (this is OK, as our limit value is maxed out. See the TLS ABI doc for more info). Now, we can examine gs and see which selector it is telling us to use:
(gdb) print $gs >> 3
$31 = 6
Above we shift out the last 3 bits, as these refer to the privilege level (bits 0 and 1) and if this is a GDT or LDT reference (bit 2). Thus, looking at the GDT descriptor for index 6:
LINUX                 48  386_TLS
  index: 6, base: 0xb6043b70, limit: 0x000fffff, flags: 0x00000051
we can finally do some maths from the base-address to figure out the value:
(gdb) print *(int*)(0xb6043b70 - 4)
$34 = 3
Thus we have found our TLS value; in this case for thread 3 the value is indeed 3. I caution this is the simplest possible case; other "models" (see the TLS doc, again) may not be so simple to work out by hand, but this would certainly be how you would start.